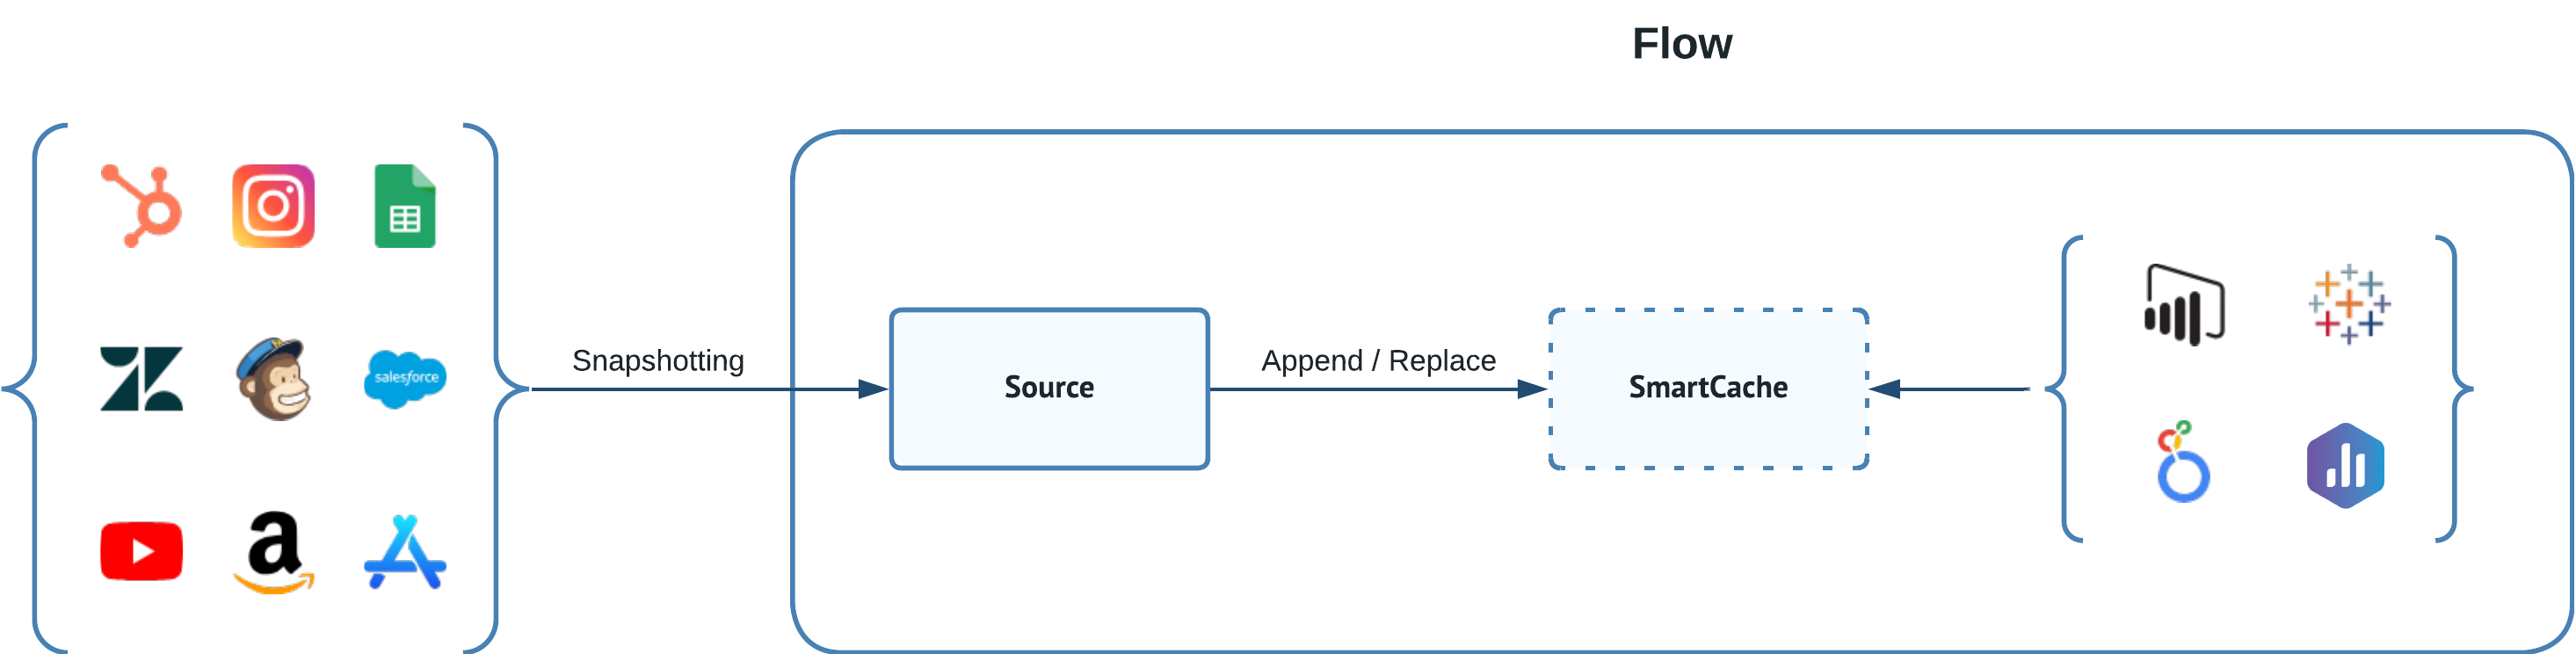
Direct data delivery to dashboarding apps like Databox, Looker Studio, PowerBI, or Tableau is a feature supported by Dataddo, which eliminates the need for an intermediate data warehouse or database. This is facilitated by our embedded SmartCache storage system, a straightforward solution ideal for scenarios not requiring extensive data volumes or complex data transformations.
Nevertheless, SmartCache is not a replacement for a data warehouse. If your data source exceeds 150,000 rows or if your data operations extend beyond simple joins, such as Data Blending and Data Union, we recommend opting for an intermediate data storage.
Understanding your Data
Before diving into the specifics of data configuration, it's vital to have a solid understanding of your data. This means recognizing its unique properties, how it changes over time, and how these changes should be reflected in your analysis.
Please refer to the decision schema below, which is designed to help you better understand your data.
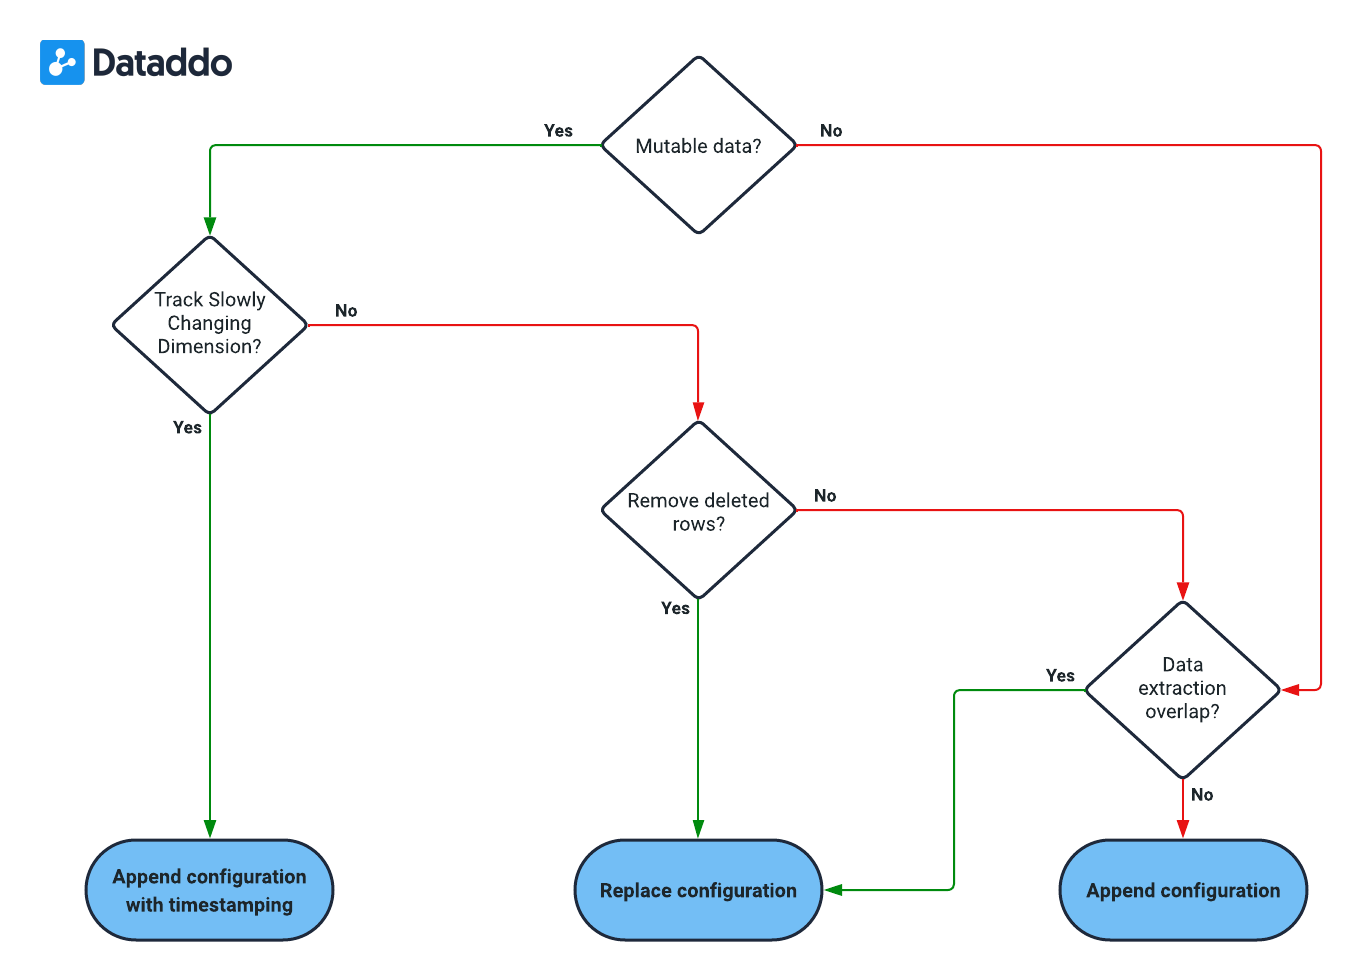
Is data mutable?
This question refers to whether the data, once extracted and defined by a common identifier, can change in subsequent extractions. In other words, it is asking if the data is subject to alteration after its initial extraction.
As an example, consider a row containing an invoice with a unique identifier, like an invoice number. If the status of the invoice changes from 'Pending' to 'Paid', would this update be captured in your next data extraction? If yes, then the data is mutable - it changes over time.
Need to Track Slowly Changing Dimensions (Changes Over Time)?
This question assesses if it's necessary to monitor and record the evolution of data values over time. In data warehousing, this concept is known as Slowly Changing Dimensions (SCD). It involves tracking changes (like updates or modifications) to data elements, keeping a historical record, and observing how these changes impact the system over time.
As an example, think about a product's price in a Product table. If the price changes, do you need to keep a record of the old price, or is it enough to just update to the new price? If keeping the historical price data is important for your analysis or business decisions, then you need to track Slowly Changing Dimensions.
Do deleted rows need removing?
This question determines if the data extraction process must account for rows that have been deleted in the source data. In other words, it's asking if the removal of records in the source must be reflected in the destination.
As an example, suppose a record is deleted from the source data. Must your data set or dashboard also reflect this deletion? If 'yes', then the deleted rows need removing.
Does Data Extraction Overlap Periods?
These questions get at the idea of whether your extraction process can include data from the same time period in multiple extractions.
As an example, consider your daily extraction process. Does each extraction include data from previous days? For instance, does Tuesday's extraction include data from Monday, and does Wednesday's extraction include data from Tuesday? If 'yes', your data extraction has overlapping periods. If each extraction only contains new data from that day, then there is no overlap.
Configurations
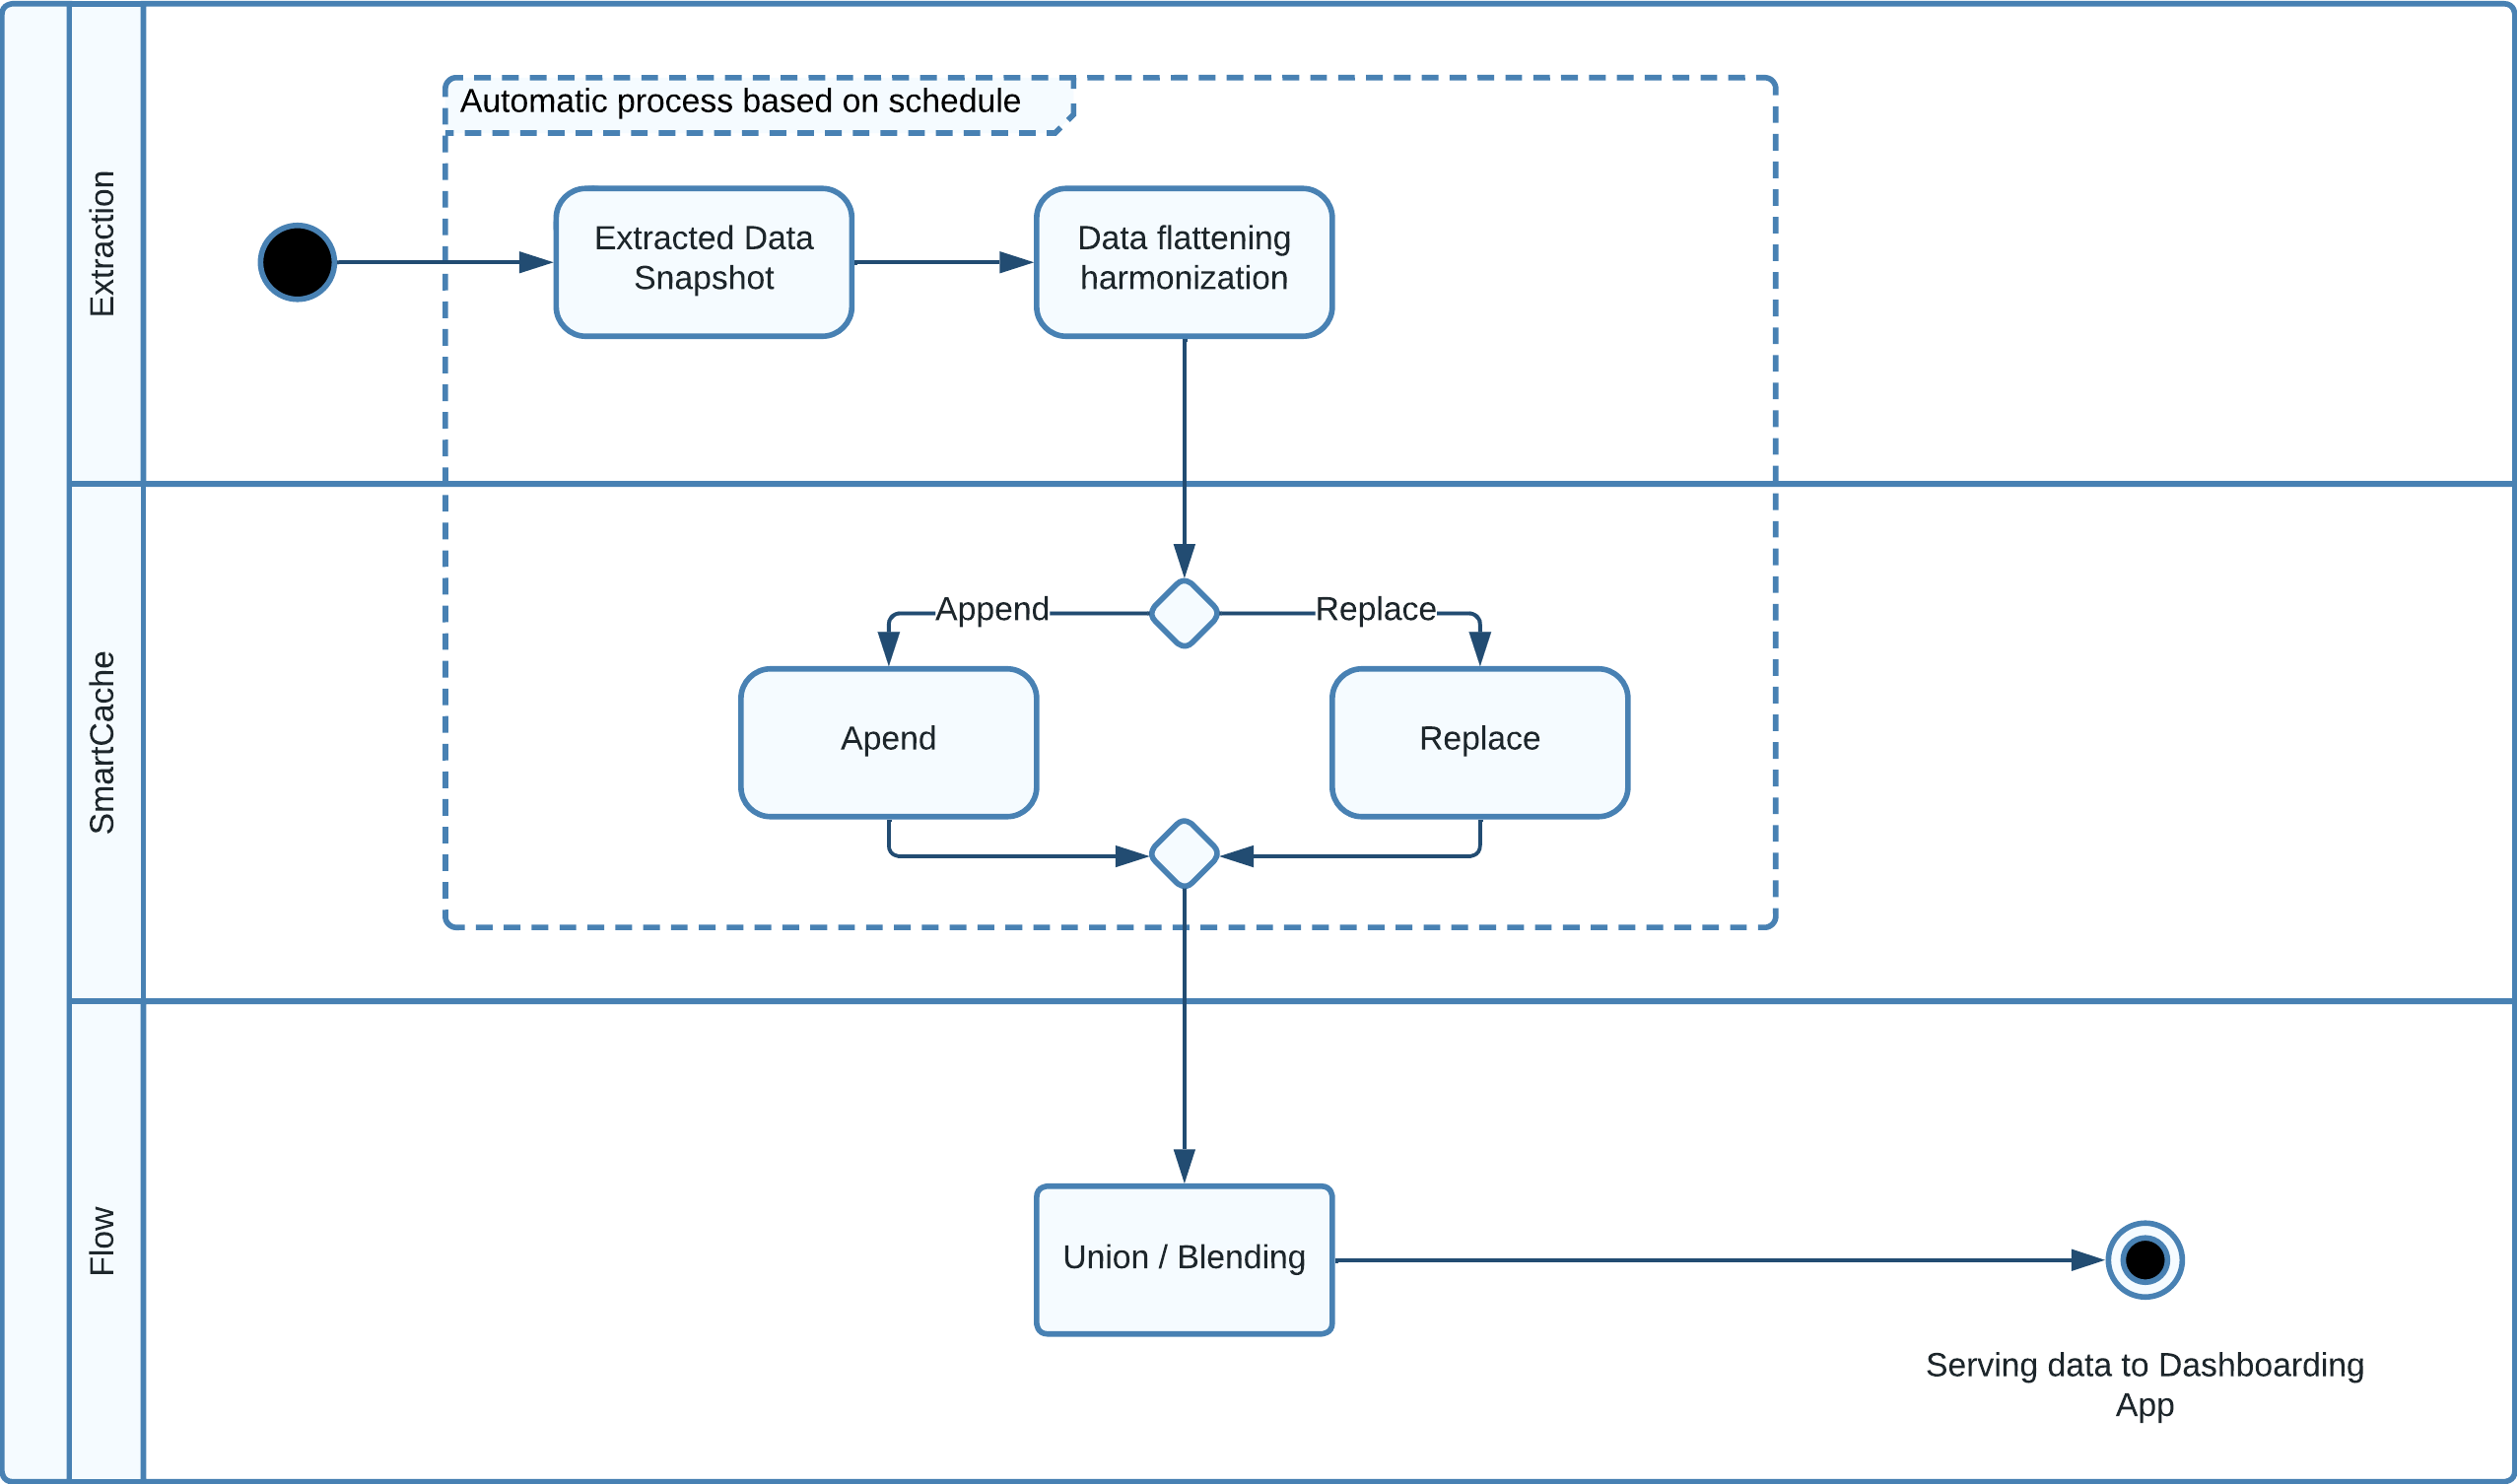
A clear understanding of Dataddo's internal process, from extraction to dashboard delivery, empowers you to align configurations with your data needs. The following diagram provides a look into these internal workings.
Append with Timestamping
In scenarios dealing with mutable data, particularly when it's essential to track slow-changing dimensions, an optimal configuration setup, Append with timestamping, comes into play.
- Configure Source with Dataddo Extraction Timestamp. This attribute setting during the data source configuration process marks the time of each extraction, enabling tracking of changes over time.
- Configure SmartCache to Append. This setting ensures each new data set is added to existing data, rather than replacing it, allowing for a complete historical view.
Consider a retail scenario where you're tracking daily stock levels of a product. The stock levels increase with new arrivals and decrease with sales.
With the "Append with timestamping" configuration, you not only retain each day's stock level but can track how it has varied over time. Without this setup, you'd only see the current quantity. With it, you gain a historical view, helping you understand stock movement patterns and informing restocking strategies.
Append
When dealing with non-mutable data and non-overlapping extractions, an ideal configuration setup is "Append".
- Configure SmartCache to Append. When setting up SmartCache, choose the 'Append' option. This ensures that each new data extraction is added to your existing dataset, building up a continuous record over time. If your source data includes a timestamp, this will be preserved, but it's not required for this setup as your data is non-mutable.
Let's say you're collecting unique daily sales data from a store, where each day's data is distinct. The "Append" configuration is specifically designed for scenarios like this, where extraction periods don't overlap.
With this setup, every new data extraction is added to your existing dataset. Since your extractions are unique and don't overlap, there's no risk of data duplication. The result is a comprehensive, historical record of sales data that grows with each non-overlapping extraction. This gives you a clear, accurate picture of sales trends over time.
Replace
The "Replace" configuration is ideal when dealing with mutable data but not needing to track slowly changing dimensions. It's also the recommended choice when working with non-mutable data where extractions overlap.
- Configure SmartCache to Replace. Setting up SmartCache with the 'Replace' option ensures that every new extraction overwrites the existing data in your dashboard. This makes certain that your dashboard always reflects the most recent state of your data.
Consider a store's inventory, where items frequently change and you only need the most current state. The "Replace" configuration is ideal, as each new extraction overwrites the old, showing the latest inventory state.
Or suppose you're collecting daily weather data for a week's period, creating overlaps. Using "Replace", each new extraction overwrites the old one, avoiding duplicates and showing only the most recent week's weather data.
Data Transformation Capabilities
Transformations can be employed at different stages in the data processing journey to ensure your data is tailored to your specific needs.
- Extraction-Level Transformations. These are performed automatically by Dataddo to make the data analytics-ready. The transformations include data flattening and harmonization, and the addition of metadata such as the Dataddo extraction timestamp for Slowly Changing Dimensions (SCD). The objective is to ensure that data is harmonized to such an extent that it can be directly used for analytics. For unique configuration needs, our generic connectors, like JSON Universal Connector, offer customizable solutions.
- Flow-Level Transformations. These are applied when data from various sources need to be unified prior to being sent to the dashboarding application. Dataddo's Data Union and Data Blending capabilities allow for this level of transformation, enabling joined-up and comprehensive data presentation.
- Presentation-Level Transformations. These are performed outside Dataddo, and are contingent on the capabilities of the individual dashboarding application (e.g. Looker Studio offers different capabilities than PowerBI). By making use of the features offered by these apps, you can further refine your data display and analysis.
Limitations
Data Volume
The recommended maximum amount of stored data per source is approximately 150,000 rows. Storing data beyond this limit could affect the performance of the reporting platform. For larger data volumes, we recommend shifting to a data warehouse solution to ensure optimal performance and data management.
Data Transformation Complexity
Dataddo provides robust data transformation capabilities for analytics-readiness and basic transformations for data unification and schema modifications, like Data Blending and Data Union. However, when the data's nature requires more complex transformations, such as advanced aggregations, complex join operations, or window functions, it would be more suitable to use a data warehouse. These systems are specifically designed to handle intricate data manipulations efficiently and effectively.