Appfigures is a mobile app analytics and insights platform. It provides tools for app developers and publishers to track and analyze their app's performance, downloads, revenue, reviews, and other relevant data across various app stores, helping them make informed decisions to improve their app's visibility and success.
Refer to our website for the list of metrics and attributes available in Dataddo.
Refer to Appfigures' official documentation to see all available endpoints from the Appfigures API.
Authorize Connection to Appfigures
In Appfigures
To authorize your Appfigures account, you will need your username, password, and client key.
To obtain the client key, follow these steps:
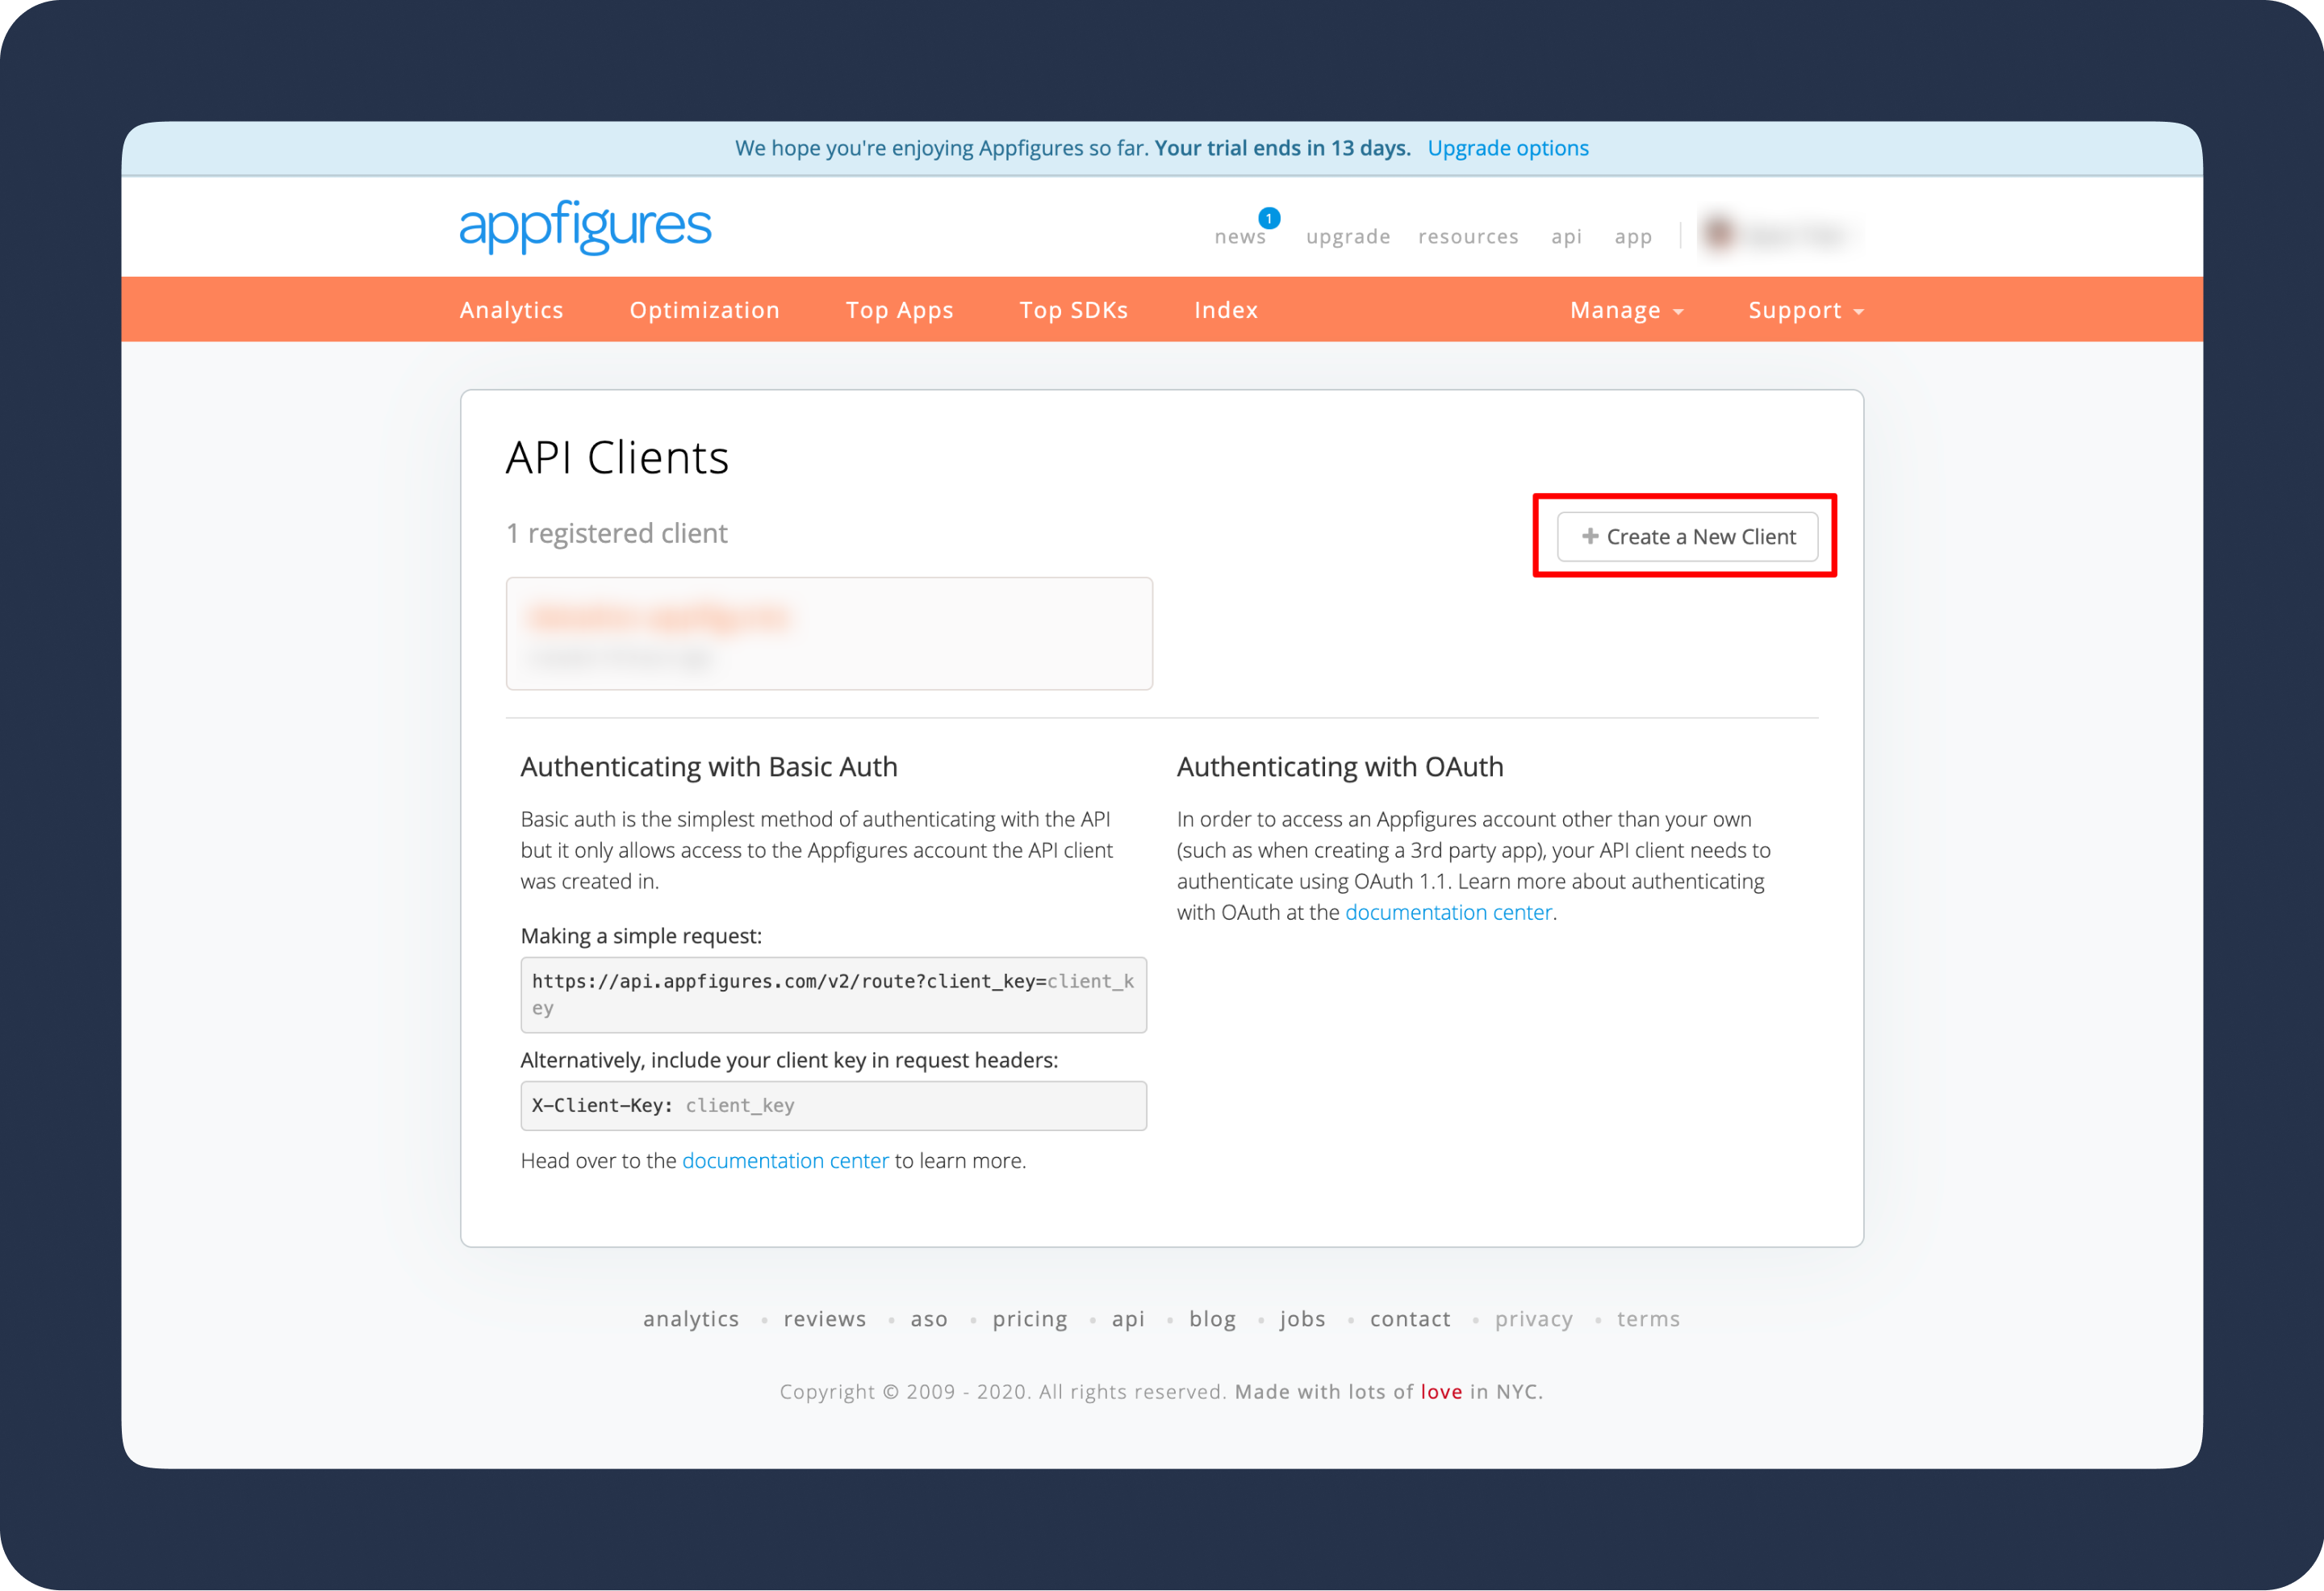
- In your Appfigures account, navigate to the developers page.
- Click on Create a new client. The best practice is to create a dedicated "service" account that will not be associated with a particular person.
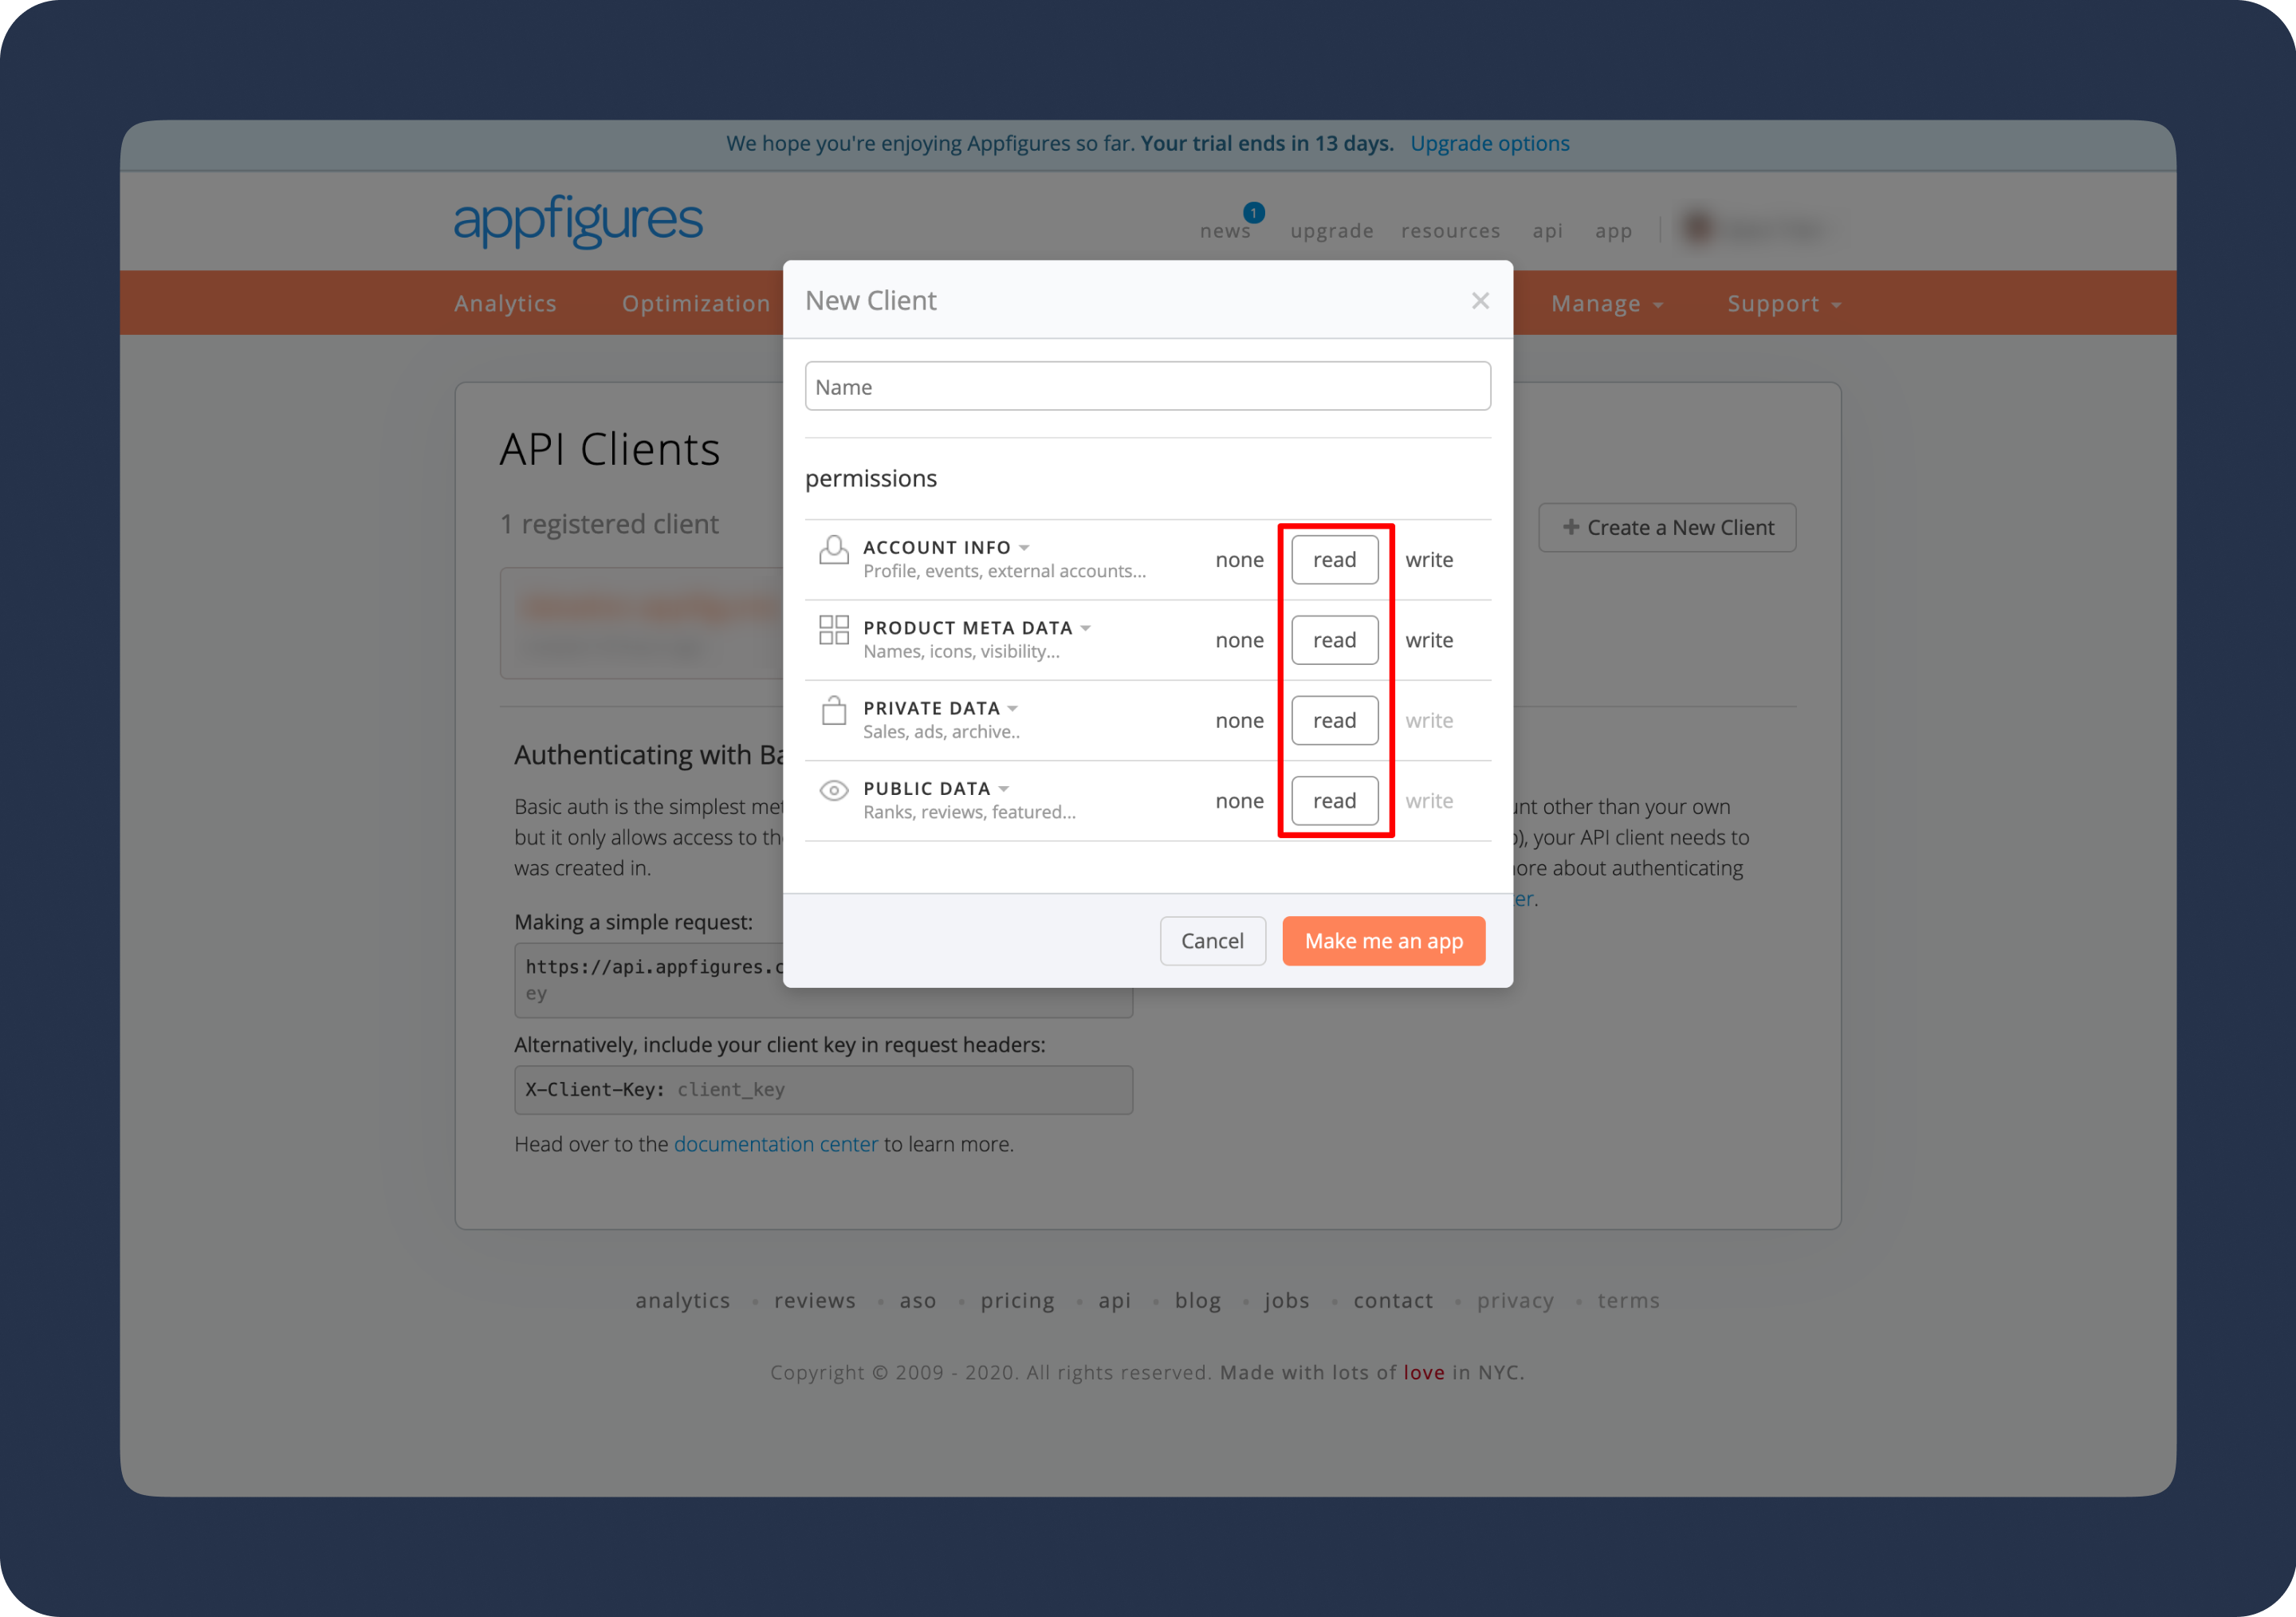
- Label the client and set all the permissions to READ.
In Dataddo
- On the Authorizers page, click on Authorize New Service and select Appfigures.
- Fill in the following fields:
- Client Key: Client key generated in Appfigures.
- Username: Your Appfigures username.
- Password: Password to your Appfigures account.
- Rename your authorizer for easier identification and click on Save.
How to Create an Appfigures Data Source
- On the Sources page, click on the Create Source button.
- Select the connector from the list and name your data source.
- On the Dataset step, select your dataset.DATADDO TIP
If you're unsure which dataset to select, use the search bar to look for datasets with the desired attributes or metrics.
- On the Account step select your authorizer from the drop-down menu.Didn't find your authorizer?
Click on Add new Account at the bottom of the drop-down and follow the on-screen prompts. You can also go to the Authorizers tab and click on Add New Service.
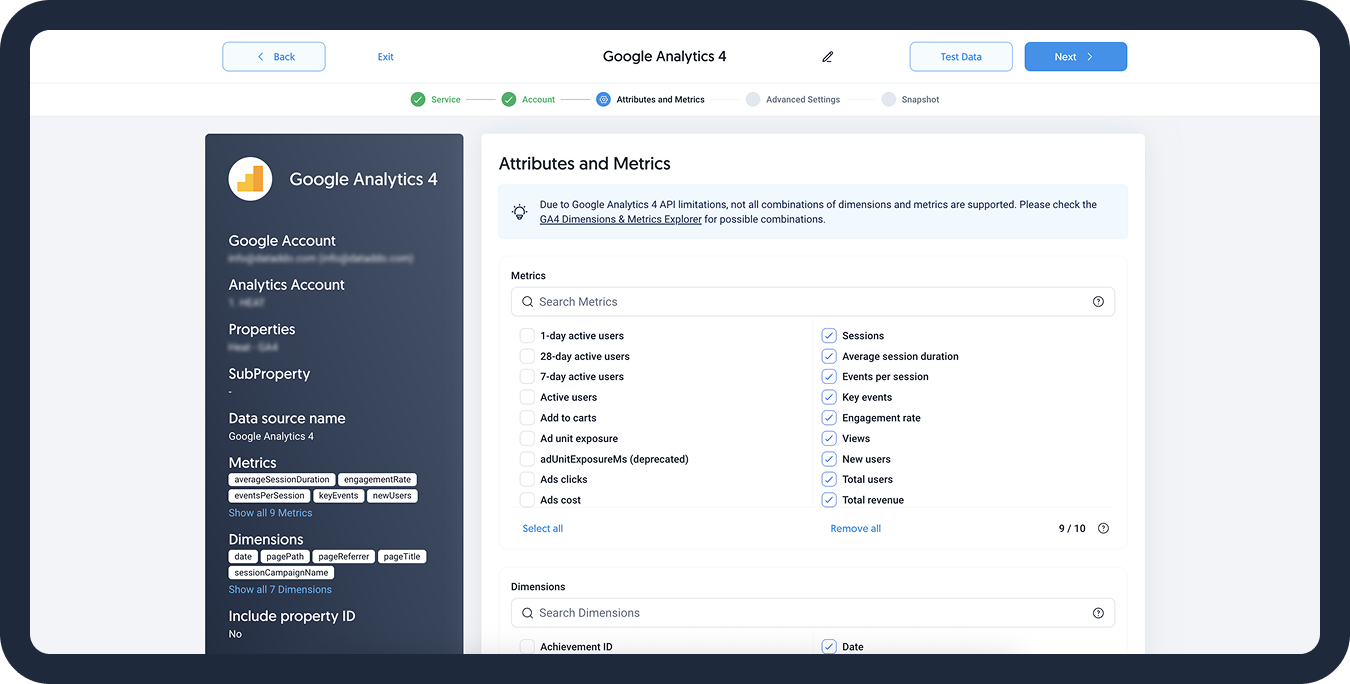
- On the Attributes and Metrics step, select the metrics and attributes you want to extract.
- On the Metadata step, select which metadata fields such as extraction time to add to your data.
- On the Snapshot step:
- Configure your sync frequency or click Show advanced settings to set the exact synchronization time.DATADDO TIP
To load historical data, refer to the Data Backfilling article.
- [Optional] Enable the Allow Empty Data Extractions toggle to allow the extraction when no data is available.
- Configure your sync frequency or click Show advanced settings to set the exact synchronization time.
- In the top-right corner, click Test Data button to preview extracted data. Adjust the date range for specific time frame.
- Click on Save and congratulations, your new data source is ready!
Troubleshooting
Data Preview Unavailable
No data preview when you click on Test Data might be caused by an issue with your source configuration. The most common causes are:
- Date range: Try a smaller date range. You can load the rest of your data afterward via manual data load.
- Insufficient permissions: Please make sure your authorized account has at least admin-level permissions.
Related Articles
Now that you have successfully created a data source, see how you can connect your data to a dashboarding app or a data storage.
Sending Data to Dashboarding Apps
Sending Data to Data Storages
Other Resources