Google Analytics
- 8 Minutes to read
- DarkLight
Google Analytics
- 8 Minutes to read
- DarkLight
As of July 2, 2023, Google Analytics has been fully replaced by Google Analytics 4 and stopped producing data. This means that your GA sources will display a 'No Data Available' error message. Historical data was available until the end of 2023.
Article summary
Did you find this summary helpful?
Thank you for your feedback!
Google Analytics or Universal Analytics is a web analytics tool that provides detailed insights and data about website and app performance. It tracks visitor behavior, traffic sources, user engagement, conversion rates, and other metrics, helping businesses understand their audience, optimize their marketing strategies, and make data-driven decisions to improve their online presence.
Refer to Google's official documentation to see all available endpoints from the Google Analytics API.
If you have multiple Google Analytics accounts and would like to extract the same data from all of them, it's possible through multi-account extraction. Contact our Solutions team to enable this feature.
Authorize Connection to Google Analytics
To authorize this service, use OAuth 2.0 to share specific data with Dataddo while keeping usernames, passwords, and other information private.
- On the Authorizers page, click on Authorize New Service and select your service.
- Follow the on-screen prompts to grant Dataddo the necessary permissions to access and retrieve your data.
- [Optional] Once your authorizer is created, click on it to change the label for easier identification.
Ensure that the account you're granting access to holds at least admin-level permissions. If necessary, assign a team member with the required permissions with the authorizer role to authenticate the service for you.
For more information, see our article on authorizers.
How to Create a New Google Analytics Data Source
- On the Sources page, click on the Create Source button and select the connector from the list.
- From the drop-down menu, choose your authorizer.Didn't find your authorizer?
Click on Add new Account at the bottom of the drop-down and follow the on-screen prompts. You can also go to the Authorizers tab and click on Add New Service.
- Name your data source and select your metrics and attributes.
- [Optional] Configure your advanced settings. If you are unsure about how to proceed, we recommend skipping this step.
- Configure your sync frequency or set the exact synchronization time under Show advanced settings.DATADDO TIP
If you need to load historical data, refer to the Data Backfilling article.
- Preview your data by clicking on the Test Data button in the top right corner. You can adjust the date range for a more specific time frame.
- Click on Save and congratulations, your new data source is ready!
Connector Overview
Combining Metrics and Dimensions
Not all the available metrics and dimensions can be combined together. If the chosen combination is not possible, it will result in a connector error. On this page, you can check the compatibility of the metrics and dimensions you have chosen.
The Google Analytics API limits the amount of extracted metrics per source. You can extract up to 10 metrics and 7 dimensions per source. If you need more metrics/dimensions, please refer to this section.
Filters and Segments
In the Dataddo app, the filters and segments applied to your source will be visible in your destination but will not affect the original data in Google Analytics.
DATADDO TIP
See the article on Google Analytics Reference Fields for a description of the metric_names needed for filter/segment creation
Filters
Filters serve as a "limiter" to the data. For example, you can select only specific countries or exclude them.
Example
You want to exclude Czechia and Ireland from your data. In this case, insert the filter as following:
ga:country!=Ireland
ga:country!=Czechia
Segments
Segments as an optional configuration help you divide your data for more simple navigation. You can, for example, segment the data by device or other specific audience segments.
You can check the segment syntax guide in the Google documentation (if the link doesn't work, simply refresh the page).
Limitations
Extracting More than 10 Metrics
If you need more than 10 metrics for a given combination of dimensions (and given that the final combination of 10+ metrics and your dimensions works together), you can create multiple sources and blend them together.
Select the same dimensions for all of the sources and then blend the sources using all of these dimensions as join keys directly in your BI tool or warehouse.
Number of Rows
The Google Analytics API has a data extraction limit of 10 000 rows per single request. Our connector features automatic pagination, so the data extraction is distributed into multiple calls, and the extraction limit can be effectively increased to 250,000 rows.
You can edit the limit of how much data is being loaded when loading historical data.
DATADDO TIP
When creating your source, check how much daily data is being loaded in the data preview. If you have already created your source, click on the three dots next to it, select Show Logs and check the number of rows.
If there is a round number (e.g. 10,000), it is highly probable that not all of your data was loaded as you might have reached the Google Analytics API limit.
Historical Data Load
Due to the Google Analytics API's limitation
- Some combinations of metrics will not work (check Google Analytics official documentation for the metrics that can be queried together)
- A maximum of 10 metrics and 7 dimensions can be selected per source
You can edit the limit of how much data is being loaded for the historical load.
TIP: How can I see if I've reached the limit?
If you see a round number (e.g. 10,000) in the logs, most likely not everything was loaded.
Check how much daily data is being loaded when creating the source in the data preview, or in the logs. Go to Sources, click on the three dots next to your source, and select Show Logs to see the row counts from the last load.
Troubleshooting
Data Preview Unavailable
No data preview when you click on Test Data might be caused by an issue with your source configuration. The most common causes are:
- Date range: Try a smaller date range. You can load the rest of your data afterward using manual data load.
- Insufficient permissions: Please make sure your authorized account has at least admin-level permissions.
- Invalid metrics, attributes, or breakdowns: You may not have any data for the selected metrics, attributes, or breakdowns.
- Incompatible combination of metrics, attributes, or breakdowns: Your selected combination cannot be queried together. Please refer to the service's documentation to view a full list of metrics that can be included in the same data source.
Duplicates in Table
Duplicates are the result of too many dimensions selected when configuring the source. Please replace with a source with less dimensions or make sure these dimensions can work together.
Example: We want to get the total daily number of sessions.
Original table
| Date | Number of Sessions |
|---|---|
| Jan 1 2022 | 2 |
Pagepath dimension (what pages are visited by every user) is added:
| Date | Number of Sessions | Page |
|---|---|---|
| Jan 1 2022 | 2 | Page 1 |
| Jan 1 2022 | 1 | Page 2 |
Total number of sessions: 3
Where is the problem?
One user visited both Page 1 and Page 2 during the same session.
The same session appeared twice in combination with each page, aka it resulted in a duplicate.
Missing Data
Missing data occurs when the total values was broken down into subcategories and the sum of the two subcategories differs. When working with your data, you need to keep this difference in mind.
This error is caused by Google being unable to retrieve the subcategory information on all of its users and this value is left blank. These blank values are then disregarded instead of being put into their own category.
This error happens most often with Gender or Country dimensions so keep the possibility of this error in mind when working with them.
Example: We want to get how many men and how many women visited my website last week.
Original table
| Total | Number |
|---|---|
| Total Users | 500 |
Gender dimension is added:
| Total | Number |
|---|---|
| Total Female Users | 200 |
| Total Male Users | 200 |
What about the rest 100 users?
This error occured because Google was not able to retrieve information on 100 users’ gender and the undetermined values were not put into a separate row.
Fresh Data Unavailable
As Google takes between 24 – 72 hours to process data, it’s possible to get data only from 3 days ago or older.
For Google Analytics, YouTube, or Google My Business, change your date range expression to 3d3 or older.
For Google Search Console, change your date range expression to 4d4 or older.
You may get fresh data from Google Analytics 4 but keep in mind that it might not be the finalized version.
Data Delay Workaround
If you need fresh Google data, Dataddo offers a way to bypass the data delay. Check our blog post on Google Data Processing Delay Workaround.
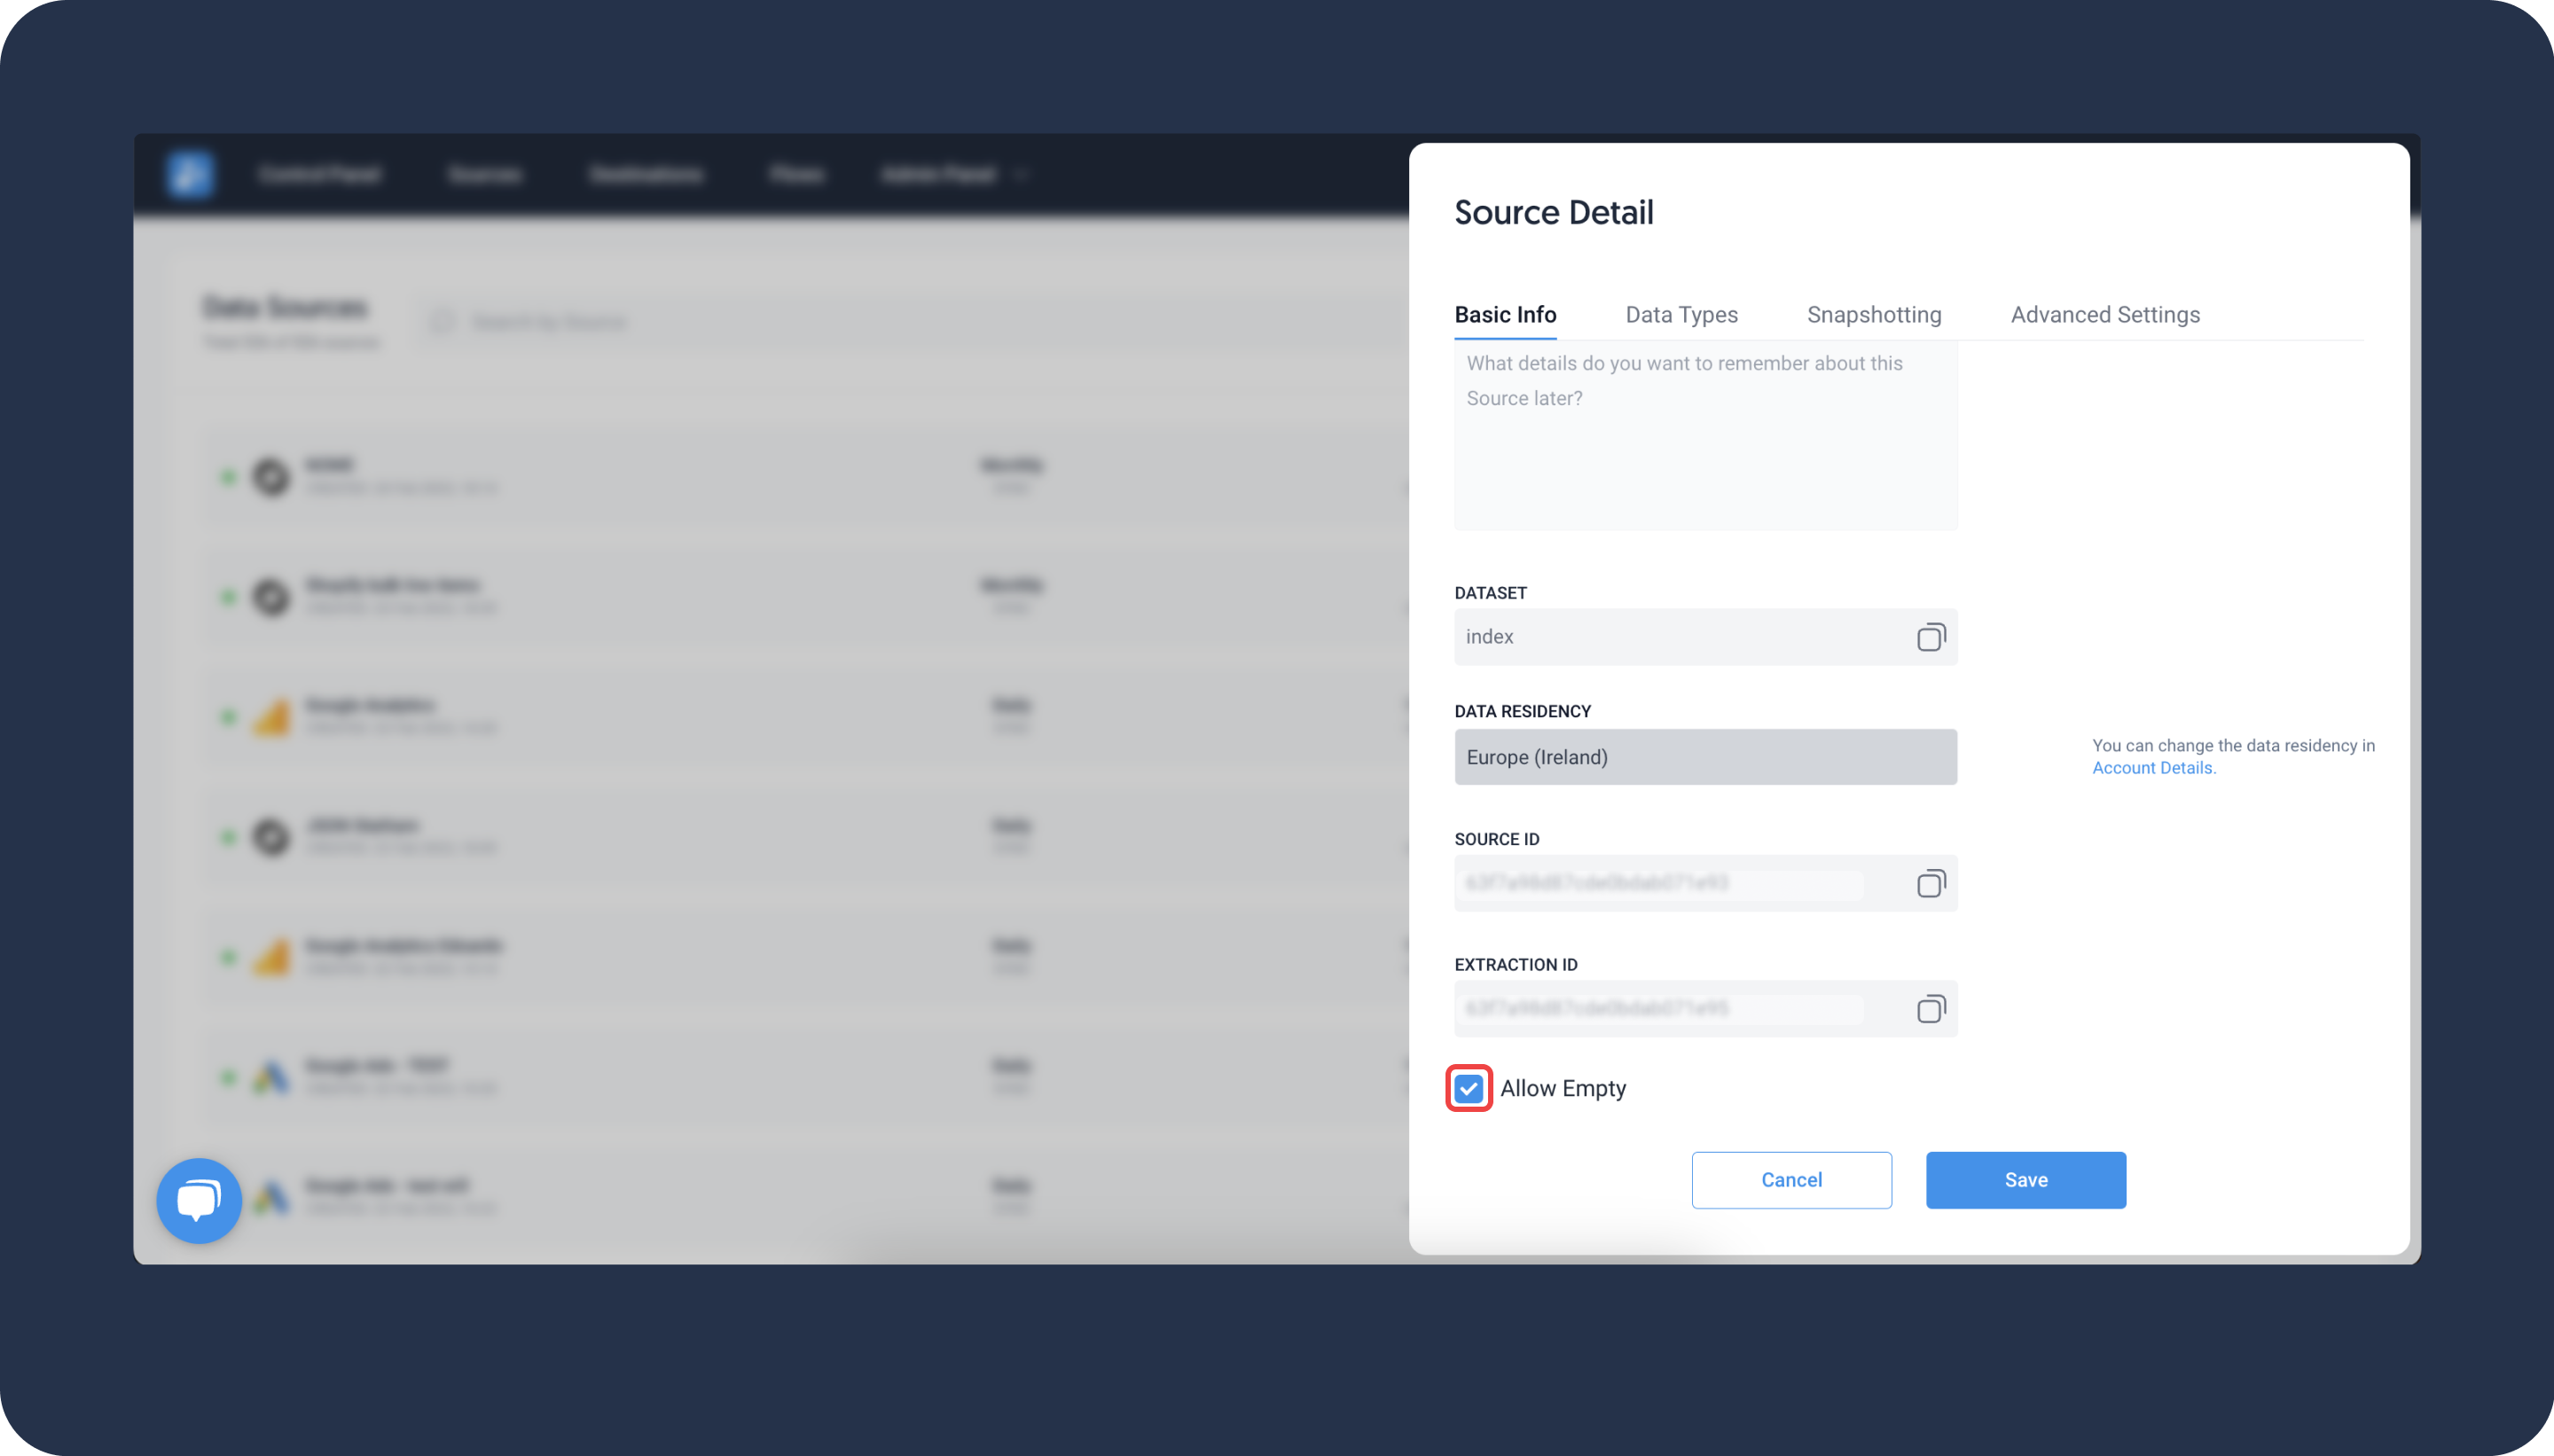
Intentionally Blank Data in Source Causing Issues
If you have no data in your source, it may lead to a broken source and further issues with synchronization. To be able to send "empty" data to your destination, check the Allow Empty box in the source's settings.
Click on the three dots next to your source, select Edit and scroll down on the Basic Info tab.
Related Articles
Now that you have successfully created a data source, see how you can connect your data to a dashboarding app or a data storage.
Sending Data to Dashboarding Apps
Sending Data to Data Storages
Other Resources
Was this article helpful?